

Written by Celia Hawk, Community Democracy Intern, Summer 2026
Baseline monitoring can help community members address concerns about environmental and personal health risks associated with data centers and other industrial development.
Baseline monitoring helps to:
Create a record that shows a variety of impacts to the environment before, during, and after development to record any potential changes
Collect data for community organizing efforts by showcasing the impacts of industrial development on the area
Potentially help meet a legal burden of proof that an industrial project negatively impacted a community
Baseline Monitoring helps establish written and visual records of environmental conditions over time. It can take years before a facility is permitted, built, and ready for operations. The time lag makes it difficult to recall pre-construction conditions accurately enough to establish a “before and after” comparison.
Baseline monitoring can help communities to:
Take information to zoning officers and local council members and ask them to hold the polluter accountable through nuisance ordinance or other local law;
Visualize data for social media and community engagement;
Use the information to make complaints to the group that issued the development permit (often the state Department of Environmental Protection or Environmental Protection Agency);
Use the data to get more funding for more “scientific” or “legally admissible” monitoring;
Build monitoring information to leverage to use for a Community Benefits Agreement or Good Neighbor Agreement;
Share information with the media to raise awareness; and
Share the data to help lawyers get a better picture of the case (even if the evidence cannot be directly presented in court).
Legal Versus Organizing Goals
Legally, baseline monitoring can prove especially helpful in Clean Air, Clean Water, and CERCLA cases, where the burden of proof requires establishing a change in environmental quality from before to after industrial development. However, baseline monitoring for legally admissible evidence must use data collection methods that meet stricter requirements. Data collection technology must be proven to be accurate, and expert testimony must be collected. Therefore, oftentimes professionals, rather than lay people, must conduct baseline monitoring to collect legally admissible records, and these professionals must complete chain of custody forms. Legal monitoring requires time, experts, and funding, so it’s often hard for community groups to do.
How To Monitor for Organizing and Public Pressure
Below are environmental concerns that communities may have regarding construction of data centers and other industrial development, and suggestions about how to conduct baseline monitoring to address those concerns.
1.Identify the issues you are most concerned about. There are many environmental and community issues that you can get a baseline on that could help you down the road – air and water quality, water pressure, noise, health, community culture, and costs. Pick the issues you are most concerned about and focus on those.
2. See if there are already groups doing this already! Many Universities, Colleges, environmental non-profits, and community groups already do citizen-science projects. Collaborating with existing groups can give you access to resources, knowledge, volunteers, and funding that take time to build up on your own.
3. Build your monitoring group. There is strength in numbers for baseline monitoring. Working as part of a larger group of neighbors or in a coalition can provide more resources, capacity, volunteers, and location availability. If you need to use your monitoring information for a complaint campaign in the future, having more people participating could put more pressure ondecision-makers to take action with the data that you’ve shared. Think about how you want to structure your group to have clear roles and responsibilities! Check out Organizing Resources and Tools for more resources on coalition-building.
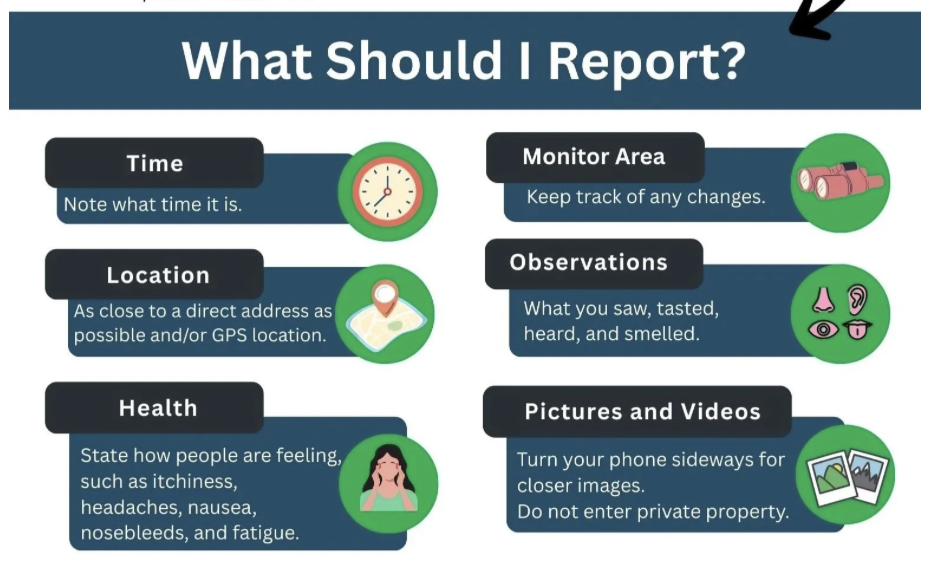
4. Start a journal independently or with a group. A variety of potential environmental changes can emerge from a new industrial development project which may not be captured within the parameters listed above. A good way to document changes that do not fall into the other categories is through journaling. The journal can be the place where you make your recordings, save photos or videos, and centrally store notes over the months and years. It can be an individual, physical journal, a google form or other online collaborative survey, a shared virtual google doc or a shared and accessible virtual space that everyone can enter information into [note: think about adding password protection to protect your journal from accidental editing, deletion, or sharing without your consent.]. Journal entries can document environmental changes such as; increases in dust and debris, smells, droughts or changes in the local watershed, neighborhood attitudes on the development, and more.
Include in your journal entries: Date, Time , Location, Weather, Things you are seeing (dust, construction, traffic), Things you are hearing (construction, generators), Things you are smelling (unusual odors), How you are feeling, and Timestamped photos and videos.
5. Start Monitoring! Below are simple and cost-effective ways that you can begin your baseline monitoring work.
-
Issues:
Data centers often rely on gas-fired energy generation with diesel backup generators. These gas-fired engines and diesel backup generators release fine particulate matter (PM2.5) and nitrogen oxides (NOx), which are linked to respiratory diseases, heart disease, and asthma. The diesel backup generators release 200 to 600 times more NOx than natural gas plants.
Monitoring Methods:
The EPA presents collected air quality data on the AirNow Interactive Map. However, some areas may not have in-depthcoverage on the map. If your goal is to collect air quality data that could potentially be presented as evidence during a trial, monitoring must follow stricter guidelines. The EPA conducts air quality monitoring upon request through a complaint form or an air sensor loan request .
To monitor air locally, there are relatively easy and low-cost ways to monitor PM2.5 through Purple Air Monitors or a similaroption from Walmart. These monitors track levels of PM2.5 Purple Air also offers a virtual map with information from 35,000 monitors worldwide, and there may be local monitors near you that are already positioned and monitoring air! Fairshake ELS offers Purple Air Monitors through the lending library. If you are going to start using a PM2.5 monitor, follow these tips:
Find the right location:
Need wi-fi and power.
Dry location.
Not in direct sunlight.
Far from daily pollution spots (such as BBQ grills, AC units, stoves, car exhaust).
Mount about head-height.
If using more than one air monitor, try to create a circle with different monitors around the item you want to monitor.
Keep wind direction in mind – you will pick up more pollution with how the wind is blowing. You can find common wind flow directions at:
Wind Rose - https://mrcc.purdue.edu/CLIMATE/
Windy.app - https://windy.app/
Maintenance:
Assign someone to check on the monitorsand make any adjustments as needed. (We recommend weekly!)
Look for patterns:
Document the following during orange or red readings:
Weather (temperature & conditions)
Any smells
Anything you can see in the air
Anything you can see that is happening that could cause pollution (could use a drone, photos, or videos to capture).
Focus on the 6-hour averages and 24-hour averages
Compare your air to current baseline standards:
EPA - 24-hour level of PM2.5 should not exceed 35 μg/m3
World Health Organization – 24-hour level of PM2.5 should not exceed 15 μg/m3
To collect data that can be presented in court, concerned parties could also contact independent air quality monitoring services. This can be expensive, but these services have the benefit of professional expertise that makes the data admissible in court. Some of these services include: SGS North America and Pace Labs. Both groups offer outdoor ambient air quality monitoring services that measure PM2.5 levels as well as a variety of other air pollutants.
Case Study
WE ACT provides a great example of community-driven air quality monitoring in Northern Manhattan. The group installs air quality monitors at schools around the city that measure particulate matter, ozone, carbon monoxide, and nitrogen oxides. The group publishes the results collected on the monitors on their website. This data is analyzed by Columbia University’s School of Public Health.
The work done by WE ACT shows how communities can use their resources to document air quality to increase local environmental knowledge. This model can be recreated in communities concerned about air quality to raise public awareness of environmental justice issues.
At Home Tests:
-Purple Air quality monitors (Available through Fair Shake’s lending library)
Expert Contacts:
- EPA Air Quality Complaint Form
More Resources:
-
Issues
During construction and operations, water can become polluted by silts or a variety of toxic substances. There have been cases in Pennsylvania and New York of water containing high levels of methane due to nearby fracking. Additionally, chemical plants pose a unique risk of contaminating nearby water. Therefore, community monitoring of water quality can be beneficial to establish a baseline and raise awareness if an issue emerges.
Monitoring Methods
Citizens can monitor their water quality through a variety of tests that come at different price points. The most affordable option is to use simple at-home water testing kits with a variety of test strips that look for a variety of pollutants such as bacteria, iron, and lead. There are also higher quality at-home tests that come with chemical reagents. These tests can measure levels of heavy metals, as well as a variety of specific concerns such as levels of lead, arsenic, and glyphosates. At-home tests, both simple and complex, can be useful to gather information for personal concerns or community organizing.
In Ohio, one way to give more weight to the evidence you collect is to participate in the Ohio Credible Data Program offered by the Ohio EPA. This program teaches participants how to monitor local quality, and at the end of the program graduates are classified as Qualified Data Collectors. Qualified Data Collectors can submit project requests to help streams/watersheds of their choice.
Case Study
Flint, Michigan’s water crisis shows the importance of baseline monitoring and citizen participation in measuring water quality. Pediatrician Dr. Mona Hanna-Attisha heard many of her patients reporting that their water was green or brown and had a bad odor. Her patients were concerned about using the water for baby formula. Therefore, she decided to conduct her own study and found that children in Flint, Michigan had elevated levels of lead in their blood. The state chose to ignore her results initially, but her research helped put pressure on the government to help with aid for the water crisis.
There are groups that are currently working on independent water quality monitoring. For example, the Sierra Club Illinois Chapter has a River Monitoring Project. This group is made up of volunteers who collect water quality data on three local streams and the group provides a good example of how organizations can work to protect water quality.
At Home Tests
Expert Contacts
Other Resources
-
Issues
Mid-size data centers use, on average, 300,000 gallons of water a day, while large data centers can use up to 5 million gallons of water per day. Recent estimates foresee that data centers in the United States could require 32 billion gallons of water annually by 2028. People living close to data centers may be concerned about decreased water pressure because of data center consumption.
Monitoring Methods
The USGS currently posts a Groundwater Monitoring Network where data regarding current groundwater levels can be accessed. This data can help to establish a preliminary understanding of local groundwater before construction begins.
To conduct personal water pressure measurements, there are monitors sold at most hardware stores, such as this monitor sold at Home Depot. Establishing a legal burden of proof is more difficult. Local plumbing companies can conduct professional assessments of water pressure within homes, which provides stronger evidence because of their access to professional technology.
Case Study
In Fayetteville, Georgia, Quality Technology Services used 29 million unmetered gallons of Fayette County water for a newly developed data center. The failure of Quality Technology Services to properly account for their water use went unnoticed until residents noticed a change in their water pressure. After residents began to complain, a public records request revealed that the company was running their data center by using two undocumented hookups to the local water system. Baseline monitoring can help communities keep track of critical changes in their water pressure.
At Home Tests
Expert Contacts
Local Plumbing Services
Other Resources
-
Issues
Development projects can increase local noise pollution, including noise from construction or electricity generation. Diesel generators in data centers can reach decibel levels that damage human hearing. Noise pollution can lead to sleep disturbance, hypertension, and heart disease. In children, noise pollution can lead to stress, raised blood pressure, and decreased quality of life. A 2024 Harvard studyfound a link between cardiovascular disease mortality and noise exposure from industrial, commercial, and community activities.
Monitoring Methods
There are a few ways to measure local noise pollution through apps that can be downloaded for free, such as the Decibel X phone appor The Noise App. NIOSH also offers a noise measuring app through the CDC. Findings from these apps are not presentable in court due to potential issues with individual phones affecting the quality of the data. However, data collected from these apps or videos of loud noises can be beneficial for community organizing or negotiation.
Another option for amateur data collection is a decibel measuring device. These can be small handheld devices, or larger monitors. Oftentimes, community members can place large decibel meters in public-facing areas as an organizing technique so that when community members pass by areas with increased noise pollution, they can see the live data on a large monitor.
Case Study
In Sterling, Virginia, noise pollution from a new data center received national attention. Neighbors of the data center complained that the noise was so unbearable that they could not even take their dogs on walks. These complaints have led to the county government working towards amending its zoning laws. Through documenting and publicizing an increase in noise pollution, the county has been able to make progress on creating more rules for data centers to follow.
At Home Tests and Monitors
-
Issues
Increases in traffic due to the construction and maintenance of a new development project cause air pollution. Specifically, traffic adds to the levels of nitrogen oxide and fine particulate matter in the area. Additionally, noise pollution and light pollution fromtraffic headlights can affect sleep, which has the potential to have long-term health impacts.
Monitoring Methods
To monitor traffic, people can use a journal to track the number of industrial trucks that pass by their house. Photo and video evidence of increases in traffic may also become useful to build evidence for community organizing or legal purposes.
Case Study
Near Egypt Valley Wildlife Area in Ohio, residents complain about losing sleep due to sharp increases in industrial traffic from recent fracking projects. Additionally, they report feeling unsafe driving on local roads due to the speed with which the trucks drive on local roads. Attention has been brought to the issue through documentation of the traffic by publications like the Alleghany Front. In response to community organizing, the Ohio Department of Natural Resources added in addendum to fracking leases in the area to ensure well pads are built outside of the wildlife area and noise pollution is limited during hunting season. However, residents seek more protection from increasing traffic and pollution.
More Resources
-
Issues
Industrial development in an area has the potential to lead to a variety of health impacts for those living nearby. As discussed above, impacts on air quality, water quality, noise pollution and more can harm physical and mental health. It is important to document any potential harms so that people can potentially receive compensation for medical care and prevent or limit harmful development projects.
Monitoring Methods
Baseline checkups and blood tests have the power to become important in legal battles if residents begin to see health effects from nearby development. Medical professionals can provide expert testimony during trials. However, their findings become better substantiated if medical records and blood tests from before the harmful industrial development can be presented, as that helps to prove a change in health pre and post development, establishing causation. It is also important to keep track of medical bills to pursue fair compensation for harms inflicted by industrial development.
Baseline medical information can also more clearly demonstrate a ‘before’ and ‘after’ to the media – instead of just relying on a person’s story, it’s able to show a clear empirical difference in how a person is feeling now versus before the facility was built.
Case Study
The West Virginia court cases against the chemical manufacturer, Dupont, for the mishandling of PFAS chemicals, showcasethe importance of medical records in court cases against industrial pollution. To prove the widespread effects of PFAS chemicals, around 70,000 residents of West Virginia were paid by Dupont to get blood tests because of court proceedings.
-
Any concerns that communities have about the impact of a data center or industrial facility can be monitored and tracked to see how the impacts play out over time. Other ideas to monitor could include:
Home prices – to track how the facility lowers or raises median and average home prices;
Land prices – to track how the facility lowers or raises industrial or farmland prices and how that impacts local businesses;
Unemployment rates – to track how the facility is impacting unemployment and job prospects;
Farmland, Agricultural, or Conservation land – to see how much ‘open’ space there is before a development versus afterward;
Migration and population growth (including age break-downs)– to see how the development brings new residents or leads to people moving away, especially focusing on young adults as many communities are excited for their kids to have local opportunities after finishing schooling;
Smells – to track when there are harsh, chemical, or egg-smelling odors present in the community, and in what types of weather or conditions.
Other Resources
Community and Environmental Defense Services, “Data Center Monitoring” https://ceds.org/data-center-monitoring/
What Now?
Overall, baseline monitoring can help to document and prove changes in environmental quality. Community members can opt to start baseline monitoring their environment whether they are concerned about the development of data centers or another form of industry near them. This work has the power to make real changes to protect the environment by educating the public on environmental health concerns and potentially aiding in establishing a burden of proof in a court of law.